
![]()
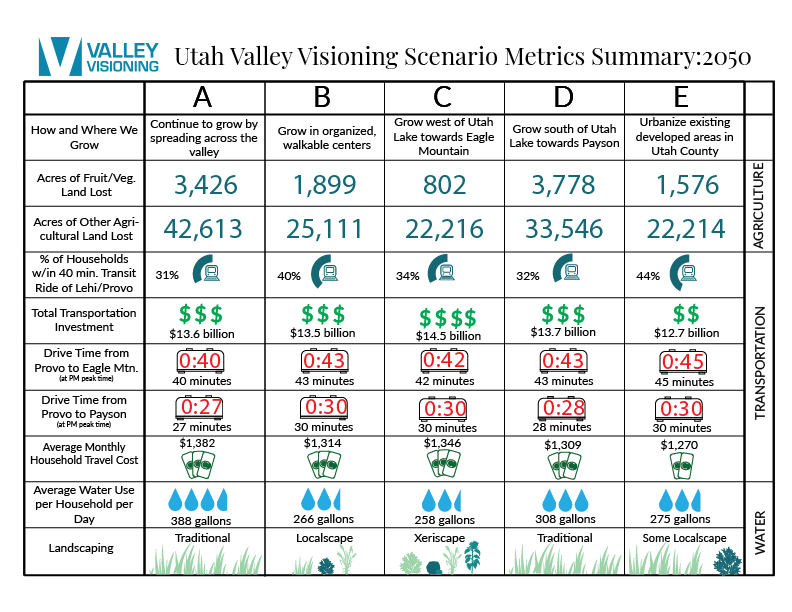
Because development occurs primarily near existing transportation infrastructure there is small countywide investment. Because homes and jobs are built in a compact pattern, there is the most traffic and traveling long-distance across the valley by car takes the longest of any scenario. However, since our jobs, family, friends, and entertainment options are closer to where we live and we build a robust grid system of arterials, our driving trips are shorter and it is more convenient to walk, bike, or ride public transportation. Investment in cycling and pedestrian infrastructure is significantly increased. Many daily trips can be completed without driving your car. As a result, we spend the least time overall in the car and the least money on fuel and maintenance. Road and transit infrastructure investment includes a partial freeway to Eagle Mountain, TRAX through the valley, and FrontRunner that’s double-tracked to run every 15 minutes and is extended to Payson. UTA ridership increases by 51,000 daily boardings vs. the lowest scenario. Significant additional funding is required to build the new public transportation infrastructure.
The chart below shows the cost in billions of dollars countywide on road and transit construction across scenarios:

The chart below shows the annual average costs spent by an household on driving across scenarios:

The chart below shows the average annual hours spent in a vehicle by a family of 4 across scenarios:

The chart below shows the travel time in minutes across Utah Valley during the PM rush hour across scenarios:
.png)